My first conference attendance of 2013 was a belter. I attended the Design of Understanding last year and it was so good I had to attend again. I wrote the bulk of this post on a train to the north and I struggled to comprehend my spider leg in ink, handwritten notes so apologies if this is very disjointed / full of misquotes/misrepresentations of the speakers at the event. I guess this was/is my understanding of the design of understanding based on my memories and notes a week and a bit later.
The first three talks of the morning sessions were all fantastic. Matt Cottam of Tellart spoke about the creation of the Google Chrome Web Lab exhibit at the National Science Museum. A wonderful tale of a lot of hard work to create a truly interactive exhibit for both physical visitors and for people interacting via the web. A theme for the day (I am assuming due to the direction of organizer Max Gadney) was showing your ‘working out’ i.e. how was it made. Matt told of the challenges from the original brief where they focused on the physics of theses displays mixing physical objects such as moving balls with digital displays. They realised this was the wrong path and that attempting to explain how the Internet actually worked was a much richer seam than some forced interaction between physical and digital objects (although the metal ball that rolled behind a screen and kicked off an animation was nice).
Matt also mentioned a great Joi Ito quote about innovation (this was not to be the last time his name was mentioned).
‘The cost of assessing risk now is greater than the cost of failing’
What they built was very impressive. It attempted to explain a number of web concepts that we take for granted such as streaming of video or the concept of the web being this physical thing i.e. billions of wires that traverse the globe under sea and over mountains. The exhibition can be visited in real life until July.
Second talk was by Joe Parry of Cambridge Intelligence, a company that specialises in mapping networks of email flow for the Enron scandal, internal vs external members of an organisation to show sales networks, networks of terrorists across Europe, networks of data centre devices and services. The software they use allows the networks to be filtered and morphed to help bring to the fore previously invisible insights such as the key email sending behaviour in Enron and who the key players were, where the terrorists connect and congregate across continents and highlight key countries involved.
He showed a brilliant image of George W. Bush staring at a giant print out of a terrorist network following the twin towers attack and he glibly said ‘I wrote the software that generated that picture’ (or something close to that, my notes are sketchy). It showed the power of paper and scale in the viewing of these networks. He mentioned the cliché of the lone investigator in films staring at the wall of information looking for the links. Still very valuable even with enhanced digital tools.
The starting hat trick was completed by Phil Gyford talking about his work on bringing Samuel Pepys diary to the web. For those unaware Phil had moved to London and decided to read Pepys famous diaries. As well as reading them he had the idea of publishing the diary entries to the web on a day by day basis linked to the day Pepys wrote his original entry. Pepys diaries spanned a period of ten years. Phil ‘finished’ this project in summer last year. He had posted a diary entry every day for ten years. As he posted he had annotated and expanded on the text by crafting a huge volume of additional commentary on the characters involved in the story, summaries of the story so far and also pulling in extra information on characters from other sources e.g. Wikipedia.

Phil played a lovely animation going back in time to 2002 when he started this project to show how little of the web we know today existed. In a time of the instant gratification web it is awe inspiring to see someone so dedicated to a thing that they would take all that time and effort to see it through. What was even more amazing was that Phil has started again. He rebuilt the site using new technologies and is now repeating the process albeit with a lot of the hard work done it is still going to be herculean task, not least crafting new Tweets. Amazing.
Lloyd Shepherd spoke about the beauty and complexity of note taking. An author by trade he had to do masses of research for his historically set novels and he was unhappy with the tools of today. They are incapable of capturing the neural connections made by the person taking the notes or the links between each note and source. He showed some great notes from Matt Jones of Berg that showed how the layout and design of those notes told so much of the story and almost showed the thought processes of the person capturing the notes. How do you represent that digitally? He has published his talk online which is very helpful for people who did not take good enough notes.
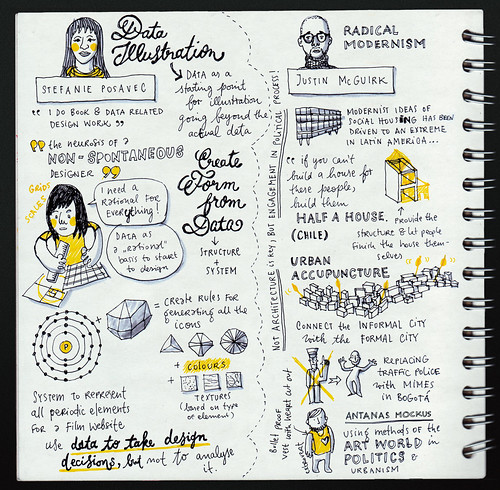
Stef Posavec is a designer who uses data in an amazing way. I have seen Stef speak three times now and I am amazed by her work and how it is made. She spoke extensively about a new project called 94 elements where she was building graphical representations of the 94 naturally occurring elements. Stef broke down how she took the various attributes of the elements and how she looked for patterns in the data that could be transformed into unique simple representations of each. She settled on the atomic numbers of the elements and ended up with gem like representations which could be enhanced with colour and texture.
The talk that caught me by surprise was by Justin McGuirk. He spoke about activist architecture in South America. In twenty minutes he taught me a lot about how ‘modern architecture had gone to South America to die’ and with it how the dreams of building homes for the poor had also failed massively. This gave way to the rise of the slums that spread prolifically and had swamped many of those architectural dreams.
Failed attempts to build sustainable housing, designs that allowed people to improve and extend were admirable but ultimately too expensive. The approach now seems to have changed. The focus has switched to building beautiful and functional buildings and spaces in the middle of the slums to basically lift the area. Examples of multi use community centres or brilliant pieces of infrastructure such as cable cars that meant journeys to the centre of cities no longer took two hours but took nine minutes made it easier for people to work but also reconnected people to wider society.
Some lovely visual notes by Eva-Lamm Lotta
The talk that probably resonated most with me was by Beeker Northam. Beeker was due to speak at last year’s event but had to cancel due the fact she was heavily pregnant with twins, who she mentioned as she was worried they would become the girls from the Shining while her partner wanted them to grow up to be like the Winklevosses. As Beeker’s maternity leave was coming to an end she was starting to think about innovation and how it should work in digital agencies but her thinking was so true that is applies far wider than the agency world. Beeker admitted it was a work in progress but I thought it was pretty close to being done.
My notes only contain three sentences as I was listening so intently. They are as follows.
‘Nearness, Collaboration, Craft > Intersection’ (this was me describing a Venn Diagram that were the key themes of the talk.
‘Anyone who says they have a ten step plan for innovation is wrong’ YES.
‘This 3D printed thing looks like take me to your dealer at Camden Market’. My garbled capture of a great joke on how 3D printing is churning out complex patterns and object that look a bit hippyish but you can clearly see it is going to change the world sooner rather than later.
Beeker also made the second great mention of Joi Ito. Talking about his approach around lots of small, measurable experiments being the closest we will get to a process for innovation. I am unable to do justice to the talk as it was a brilliant collection of thinking that I am incapable of explaining.
As my colleague Betony said after it had finished ‘I thought you were going to take off your shirt and start roaring COME ON!’ thankfully for all attendees I did not. Fantastic.
Last talk of note was Ben Terrett, Head of Design at the Government Digital Service. He had to follow a lady from the BBC who talked about their Olympics offering i.e a load of stirring clips and some stats about how impressive their online service was, which was very impressive but felt like cheating.
Now obviously I am a GDS fanboy. The way they are doing IT right in a big bureaucratic organisation is obviously impressive. Again it was good to see how they were going about that from the aspiration to build something in the digital space as important as the road sign designs of Margaret Calvert (who they were actually working with and was a fierce critic and continued inspiration.)
The space to put so much effort into design is something I am in awe of. 250 staff at GDS. 16 designers. Strong ratio.
Combined working. New approaches were being tried at the GDS. Instead of designers crafting and pushing pixels in Photoshop they designed in the browser. This meant a designer and a front end coder would pair up and build together. So obvious yet so brilliant.
Mission patches. The thing that inspires me about GDS is the purpose. It drips out of everything they do. I am sure it is not all sweetness and light but from the outside it looks pretty bloody good. Ben shared a great example of mission patches, borrowed from NASA. For each major piece of development and release they handed out mission patches to all involved. These stickers are badges of honour on the laptops of those involved. A seemingly simple thing but a great display of team work.

Paring back to an absolute minimum. Ben gave a great example of some feedback from Margaret Calvert where she had challenged them to really go back to basics with information design. What did the page design look like with a single font at a single weight? Was it still clear and understandable? This minimum viable approach helped shape their thinking and while they did not stick with one font and one weight they only use three weights and the single font they chose was actually the digital version of Transport, the font used on the road signs and designed by you know who.
Like so many of the talks it was a shame this was not recorded in any way. I guess my last words on it will be this…
‘What is the user need, not what is the government need’ Replace the word government with your industry and there is the focus so often disregarded. If you forget that then you are only going to be ever designing from a point of misunderstanding.

Comments
[…] Design of Understanding 2013 — Aden Davies Design of Understanding 2013 — Rodcorp Sketchnotes — Eva-Lotta Lamm […]